Study
The 10% rule is wrong: 500 rooms analysed
“Add 10% for waste” appears in every DIY guide. We ran 500 floor plans through the same laying engine the tool uses and measured the actual material surplus. Result: the median is 8.4% – so the rule of thumb sounds plausible. It just almost never applies. Only 106 of the 500 rooms (21%) land in the window between 8 and 12% at all. In 202 rooms (40%) 10% is not enough, in 148 rooms (30%) less than 5% would do. The range runs from below 0% to 58.5%. A rule that misses in four out of five cases is not a rule, it is an average with marketing.
The planning tool opens after free sign-up.
By the floorplanning.app editorial team
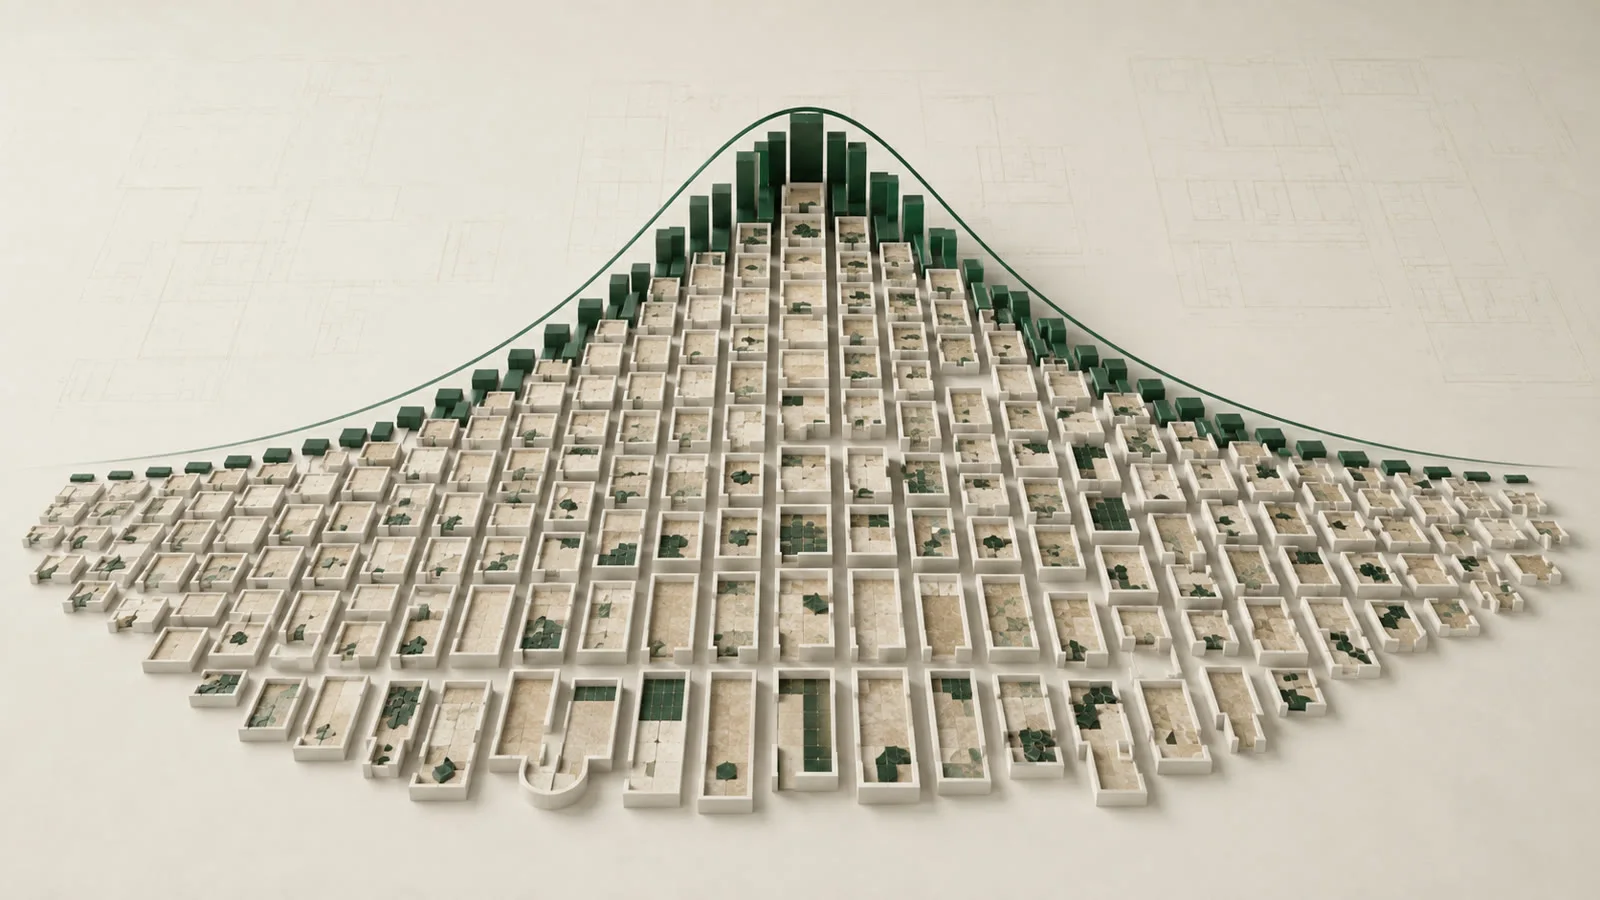
Computed, not estimated
Each of the 500 cases was laid in full: the grid is placed over the real room geometry, every tile checked individually, every cut counted and every reusable offcut credited back to the purchase quantity. No surcharge factor, no formula – the same computation that sits behind every number in the tool.

What matters in practice

The real driver is not the area
The best predictor is not the square metres but how many tiles fit into the room at all. Rooms taking fewer than 25 tiles need a median surcharge of 17.2% – and more than 10% in 82% of cases. At 150 to 400 tiles the median drops to 2.0%, and not a single room exceeds 10%. The perimeter stays the same length while the area grows: that is the entire mathematics behind it.
Large format costs twice
Formats up to 30×30 got by with a median surcharge of 2.4%, formats from 60×80 needed 13.9% – almost six times as much. With large formats 70% of rooms exceeded the 10% mark, with small formats only 8%. Switching to 120 cm slabs therefore costs more than the higher price per square metre: you also buy considerably more area than you lay.
Offcuts beat any rule of thumb
Calculating like a novice – every cut tile is used up – pushes the median to 13.8% and 65% of rooms above 10%. If clean offcut strips are reused elsewhere, the demand drops by a median of 5.5 percentage points. This single working practice changes the result more than any choice of starting point or laying direction.
The most surprising finding: optimization gains nothing here
We additionally searched for the most material-efficient grid offset for every room. In 497 of 500 cases the optimizer found nothing better than the simple flush start in the corner. That is not an argument against optimization but a clarification: it pays off exactly where you deliberately do not start flush – with symmetrical axes, patterns and rotated grids. For a straight bond against the wall the naive start is already optimal.
Distribution of material surplus across 500 rooms
Each bar counts rooms. If the 10% rule were right, everything would crowd around the marked band. Instead the distribution is broad and right-skewed: the upward outliers are small rooms with large formats.
Surplus by room size
The smaller the room, the more the perimeter weighs. Below 4 m² the 10% rule is too tight in almost three out of four cases.
| Room size | Rooms | Median | Top tenth | Above 10% |
|---|---|---|---|---|
| under 4 m² | 50 | 15.0% | 35.9% | 72% |
| 4–8 m² | 99 | 10.2% | 26.4% | 54% |
| 8–15 m² | 166 | 9.7% | 19.6% | 48% |
| 15–25 m² | 113 | 6.2% | 13.4% | 27% |
| over 25 m² | 72 | 4.9% | 9.0% | 6% |
Surplus by tiles per room
The most meaningful figure: how many tiles fit into the area at all? Knowing that value, you no longer need a rule of thumb.
| Tiles in the room | Rooms | Median | Top tenth | Above 10% |
|---|---|---|---|---|
| up to 25 | 140 | 17.2% | 32.7% | 82% |
| 25–60 | 189 | 9.2% | 14.8% | 43% |
| 60–150 | 121 | 5.3% | 8.6% | 5% |
| 150–400 | 47 | 2.0% | 4.3% | 0% |
Surplus by room type
No room type is “at fault” – the order simply follows typical size and the usual format.
| Room type | Rooms | Median | Top tenth | Above 10% |
|---|---|---|---|---|
| Guest WC | 40 | 15.0% | 36.1% | 73% |
| Balcony | 35 | 12.4% | 26.9% | 74% |
| Hallway | 75 | 9.6% | 26.8% | 47% |
| Kitchen | 65 | 9.6% | 16.7% | 49% |
| Bathroom | 85 | 9.1% | 17.4% | 42% |
| Bedroom | 60 | 7.3% | 19.8% | 33% |
| Terrace | 60 | 6.6% | 17.2% | 25% |
| Living room | 80 | 4.9% | 10.4% | 11% |
Raw data and method
All 500 cases individually, with dimensions, format, joint width, cut count and the surplus in five scenarios. Free to use with the citation “floorplanning.app, tile waste study 2026” and a link to this page. For questions, replications or custom analyses, just get in touch.
- Raw data for all 500 rooms (CSV, 48 KB)Semicolon-separated, opens directly in Excel or Numbers.
- Aggregated key figures (JSON)Every analysis on this page, including group statistics and the histogram.
Method: how the 500 rooms were computed
The study is deliberately built to be reproducible. The room catalogue is generated from a fixed seed, the laying comes from the production computation of floorplanning.app, and both result files are available above. Using the seed and script returns exactly the same numbers.
- Sample: 500 rooms from eight room types (bathroom, guest WC, kitchen, living room, bedroom, hallway, terrace, balcony), dimensions rounded to 5 cm, 29% of them L-shaped or with a recess.
- Formats: eight indoor formats from 20×20 to 60×120 and five outdoor formats, weighted by market prevalence; joints 3 mm indoors, 5 mm outdoors.
- Computation: calculateTileLayout places the grid over the real geometry and counts every tile individually; computeOffcutReuse credits clean offcut strips (3 mm kerf, 8 cm minimum offcut, one cut per tile).
- Metric: surplus = purchased tile area divided by net room area minus 1. Reserve for breakage is deliberately excluded.
- Scenarios per room: flush wall start, tile centred, joint centred, optimized offset, format rotated by 90°.
- Limits: straight laying only, no patterns, no diagonal, no skirting and no transport breakage. The catalogue is synthetic – no customer projects were analysed.
What follows for your order
1. Treat the rule of thumb as a fallback
10% is a number for when you do not know the room. As soon as you have dimensions and format, there is something better.
2. Look at room and format together
It is not the square metres that decide but how many tiles fit. Below 25 tiles it gets expensive.
3. Plan for offcuts
Consistently reusing offcut strips saves a median of 5.5 percentage points – more than any grid optimization.
4. Add breakage reserve separately
The measured values contain no breakage. The usual 2–5% comes on top of the calculated demand.
Examples from the tool
This is what it looks like planned out
The numbers above do not come from a spreadsheet but from a real layout. You can open these example projects directly – floor plan, laying plan and material list, exactly as the tool outputs them.

Format comparison: 60 × 60 vs 30 × 60
Two identically sized rooms side by side, only the format differs – each with its own row in the material table. Here the smaller format needs more material, because room dimensions decide, not tile size alone.
- 2 × 13.49 m² · 8% reserve
- 60 × 60 → 46 tiles = 16.6 m²
- 30 × 60 → 98 tiles = 17.6 m²

Reusing offcuts
A utility room where 24 full tiles meet 24 cuts. Switch on offcut reuse in the tool and 10 of the 48 tiles disappear.
- 10.73 m² · 60 × 60 · 3 mm joint
- 24 full tiles, 24 cuts
- With offcut reuse in the tool: −10 tiles
Opens the read-only client view of a share – the same one you create for your own projects with Premium.
Questions about the study
How much waste do you really need to allow for with tiles?
There is no single value. Across 500 rooms the median was 8.4%, but the range spans below 0% to 58.5%. As rough orientation: large rooms with small formats 2–5%, medium rooms 8–12%, small rooms with large formats 15–25%. It only becomes reliable when you compute the specific room.
Why is the surplus below 0% in some rooms?
Because joints count towards the room area but not towards the tile. If a grid works out almost perfectly, the purchased tile area covers marginally less than the raw room area. This affected 8 of the 500 rooms and is an arithmetic artefact, not a purchasing tip – nobody should order with no reserve at all.
Where do the 500 rooms come from?
From a deterministically generated catalogue of typical residential geometries – no customer data, no stored projects. Dimensions, formats and joint widths come from market-standard ranges per room type; seed and script are published. Anyone re-running the study gets exactly the same 500 rooms.
Does this apply to herringbone or diagonal laying too?
No, and that is deliberate. All 500 cases are laid straight so the effect of room size and format stays cleanly isolated. Diagonal and herringbone lie systematically above, because there every row is cut even along straight walls.
Is breakage during transport included?
No. The study measures only the geometric surplus caused by cuts. Breakage, mis-cuts and later repairs come on top – typically 2–5%, independent of the value measured here.
May I quote the figures?
Yes, gladly – with the citation “floorplanning.app, tile waste study 2026” and a link to this page. Raw data and aggregates are available above so any newsroom can verify them.
Related guides
- Centre or wall: where do you start?Centre or wall edge? The axis decides symmetry and material demand. Analysis of 500 rooms plus a live comparison of both starting points on the floor…
- Tiling a hallway: across or lengthwise?In a hallway the laying direction decides looks and waste. Numbers from 35 hallway cases plus a side-by-side comparison of both directions on the…
- Optimize offcuts and reduce wasteOptimize offcuts when laying: test orientations automatically, reuse leftovers and read the reduced purchase quantity from the cutting plan.
- Calculate waste for your own roomCalculate tile waste from room shape, tile size, and laying direction. Compare optimized layouts and reduce the amount of material you need.
Compute your own room instead of a median
Enter your room dimensions and format – the same engine that computed this study returns your specific demand including cuts.
The planning tool opens after free sign-up.